Borehole View
A borehole view represents a collection of logs and drawing objects
used to graphically display data for one or more boreholes. A borehole
view may be derived from a template
file or it can be created from a default view window with the necessary
log items defined to create the borehole. The borehole view displays the
true data for the project once data are defined in the project file.
You are presented with an empty borehole view when you first start Strater.
Opening a New Borehole View
During a Strater
session, new projects with an empty borehole view are created with the
File | New Project command. New
borehole views in an existing project are created with the Home
| New | Borehole View command. Alternatively, you can right-click
in the View Manager and select
New Borehole View.
Opening an Existing Borehole View
Existing borehole views are opened by clicking the appropriate Borehole tab, checking the box next
to the borehole name in the View Manager,
or by selecting Window |[Borehole name].
By default, the first borehole view is named Borehole
1 so this borehole view would be opened by choosing the Window
| Borehole 1 command. To open an existing project, use the
File | Open command.
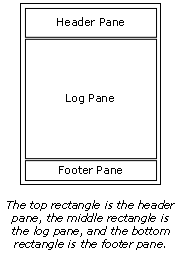 There
are three main components of a borehole view: the log pane, header
pane, and footer pane. The panes are outlined when you open a blank borehole
view. The upper rectangle is the header pane, the middle rectangle is
the log pane, and the bottom rectangle is the footer pane. You can change
the rectangle line properties in the View
Properties. The size of the header, log, and footer panes is defined
by clicking File
| Page Setup.
There
are three main components of a borehole view: the log pane, header
pane, and footer pane. The panes are outlined when you open a blank borehole
view. The upper rectangle is the header pane, the middle rectangle is
the log pane, and the bottom rectangle is the footer pane. You can change
the rectangle line properties in the View
Properties. The size of the header, log, and footer panes is defined
by clicking File
| Page Setup.
The header and footer panes generally contain static,
unlinked information. The header and footer items are used repeatedly
with minimal changes when different borehole data are applied to the view.
Two objects are exceptions to the static unlinked information "rule":
linked text and some scale bars. Linked
text data changes as new data is applied to the view. Horizontal scale bars can be associated
with some log items, a cross section, or they can be created as a stand-alone,
static object. When the scale bar is linked to a log or cross section,
the scale bar changes as changes are made to the linked item.
The log pane contains all the graphical log
items to display the borehole data. This pane is dependent on linked
tables and columns to create the graphical view. The log pane is also
dependent on depth and scaling values. These values determine the size
of the pane rectangle and/or the number of pages. The log pane can also
contain legends, text and linked text, drawn objects, and imported images,
as well.
Multiple Boreholes in the Borehole View
Strater permits
multiple boreholes to
appear in the same borehole view. You can define multiple boreholes with
a single table, distinguished by a hole ID, or you can create several
tables that define different boreholes in each table. This allows you
to quickly change the borehole graphics in the borehole view.
Appended to the borehole view name is the borehole ID associated with
the data displayed in the view. In the following example, the Hole
ID of this borehole view is DH-2:
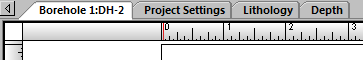
Click the borehole tab at
the top of the
Strater
window to open a borehole view.
If there is more than one borehole represented by the logs in a borehole
view, the associated borehole view tab's name ends with -Multi-.

If there is more than one
borehole in the borehole
view, the label of the tab
reads -Multi-.
Types of Logs
Strater creates 14 different
types of logs in the borehole view. Click on the links below for more
information on each of the log types.
Depth
Log
Line/Symbol
Log
Lithology
Log
Complex
Text Log
Zone
Bar Log
Bar
Log
Percentage
Log
Post
Log
Classed
Post Log
Graphic
Log
Well
Construction Log
Registered
Raster Log
Unregistered
Raster Log
Tadpole
Log
Crossplot
Log
Function
Log
Adding Additional Information to the Borehole View
Scale bars, linked
text, drawing
objects, legends, and images
can be added to the borehole view at any location.
Creating a Log in the Borehole View
For detailed information, refer to the Creating
a Borehole topic. In general, you can add a log to any borehole view
by following these steps:
Click
the Log | Create Log | [log type]
command for the object you want to create. For instance, if
you want to create a line/symbol log, click the Log
| Create Log | Line/Symbol command.
Click
on the log pane where you want the log to be located.
In
the dialog, select the data file to use. An existing table can be
selected in the Use Current Table
list.
If
a new data file was selected, step through the importing
process. The log will be displayed.
Any
customizations can be made by selecting
the log and making changes in the Property
Manager.
See Also
Strater
User Interface
Borehole
View Properties
Menu
Commands
Templates
Scheme
Editor
Options
Selecting
Objects
Sizing
Objects
Design
Mode
Export
Export
Multiple Logs
Print
Print
Multiple Logs
Property
Manager
Object
Manager
View
Manager