Click the Log | Create Log | Line/Symbol command to create a log that is used to display data as a line, as symbols, or as a combination of line and symbols. The line connects the data in the depth order. Line/Symbol logs can display labels, and can be filled to a cutoff value. Line/symbol logs are useful for displaying assay values, geophysical parameters, moisture content, etc. Data from multiple columns can be displayed as multiple line/symbol plots on a single log.
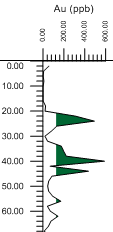
This line/symbol log displays a
green fill that extends from
the log to the left at a cutoff value.
Line/symbol logs use depth or interval data tables. In the data table, there are three required columns. The required columns are Hole ID, Depth, and the data column being displayed. Points are plotted along the horizontal axis at the value recorded in the data column. Points are plotted at the depth recorded in the depth column for each row.
Interval table types can be used. When an interval table type is used, the point is plotted at the center point of the interval. For instance, if the interval goes From 1 To 4, the point is plotted at 2.5 on the depth axis.
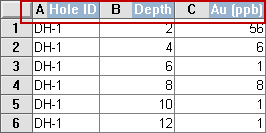
The Hole ID, Depth, and one column of data
are required for a line/symbol log.
To create a line/symbol log:
Click the Log | Create Log | Line/Symbol command.
Click inside the log pane where you want the line/symbol log to appear.
In the Open dialog, click on the data file. If the data was already imported, click on the table name in the Use Current Table section. Click Open.
Set the data importing options in the Specify Worksheet Column Definitions dialog, if necessary, and click Next.
Finish the importing of data in the Specify Data Type and Column Positions dialog and click Finish.
The log appears in the borehole window.
If you are in active mode a line/symbol log is created using the default properties. If you are in design mode, a line/symbol log graphic is displayed as a place holder after step 2. The line/symbol log is named after the data table used to create the log, since the line/symbol log can contain more than one variable. By default a scale bar is created for each variable in the line/symbol log.
To change the features of a line/symbol log, including the data column used to create the log, click on the line/symbol log in the Object Manager or view window. The properties are listed in the Property Manager.
The following tabs are listed in the Property Manager:
The Fill page is not available for deviated line/symbol logs in a cross section, i.e. the Display logs as deviated property is checked in the cross section properties for a line/symbol log cross section.
See Also