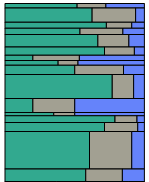
Percentage logs can display bars.
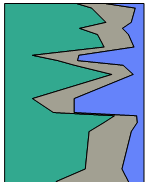
Percentage logs can display lines.
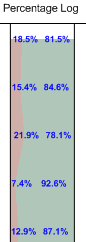
You can add labels, indicating the percentages.
Click the Log | Create Log | Percentage command to create a log that is used to display multiple data columns as different length bars, based on the relative percentages. The percentage log is commonly used to show the different percentage of alterations in a sample; the amounts of sand, clay, gravel, silt, etc. relative to each other. The percentage log uses data columns to create a series of blocks (interval data) or polygons (depth data).
|
|
|
|
Percentage logs can display bars. |
Percentage logs can display lines. |
|
You can add labels, indicating the percentages. |
Percentage logs use depth or interval data tables. In the data table, there are at least three required columns. The required columns are Hole ID, Depth, and the data column(s) being displayed. Bars are displayed for interval tables, with the center of the bar positioned at the center of the interval. Lines are displayed for depth tables, with each point displayed at the depth value.
Any number of numerical columns can be used from the table. If you select five columns, five different blocks or lines are created for each row. You do not need to input normalized data. If the data are normalized, Strater still calculates the values. The data for each row automatically add to 100 percent, so the data in each row's column can be any value because the 100% is based on the data in each row.
For example, there are three columns with gold, silver, and copper concentrations in the data. The gold value is 22 ppb, the silver value is 33 ppb, and the copper value is 66 ppb. Strater automatically adds all the values together for a total of 121. Each component is then divided by this amount to determine the percentage of the block should be created for this component. Gold would represent 18 percent of this total, silver 27 percent, and copper 55 percent.
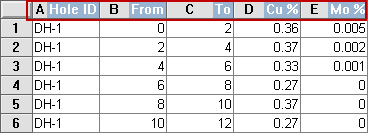
The Hole ID, Depth (or From and To), and at least two columns
of data are required for a percentage log.
To create a percentage log:
Click the Log | Create Log | Percentage command.
Click inside the log pane where you want the percentage log to appear.
In the Open dialog, click on the data file. If the data was already imported, click on the table name in the Use Current Table section. Click Open.
Set the data importing options in the Specify Worksheet Column Definitions dialog, if necessary, and click Next.
Finish the importing of data in the Specify Data Type and Column Positions dialog and click Finish.
The log appears in the borehole window.
If you are in active mode a percentage log is created using the default properties. If you are in design mode, a percentage log graphic is displayed as a place holder after step 2.
To change the features of a percentage log, including the data columns used to create the log, click on the percentage log in the Object Manager or view window. The properties are listed in the Property Manager.
To change the columns associated with the percentage log, click on the Percentage Log tab in the Property Manager. Click the Percentage Columns button and select the columns in the dialog.
The following tabs are listed in the Property Manager:
See Also