Click the Log | Create Log | Crossplot command to create a crossplot log. Crossplot logs display two intersecting line/symbol logs. Each log has separate options and can be displayed as lines, as symbols, or as a combination of line and symbols. The line connects the data for each log in the depth order. Crossplot logs can display labels, and can be filled. Crossplot logs are useful for displaying intersections of two data curves on a graph.
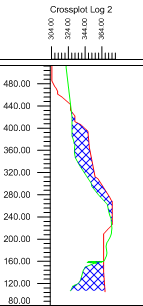
This crossplot log shows the area
where one plot intersects and is
greater than the values of another plot.
Crossplot logs use depth or interval data tables. In the data table, there are four required columns. The required columns are Hole ID, Depth, and the two data columns being displayed. Points are plotted along the horizontal axis at the value recorded in the data columns. Each line has a separate scale. Points are plotted at the depth recorded in the depth column for each row.
Interval table types can be used. When an interval table type is used, the point is plotted at the center point of the interval. For instance, if the interval goes From 1 To 4, the point is plotted at 2.5 on the depth axis.
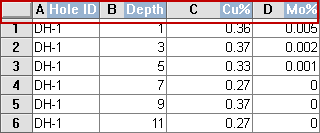
Crossplot logs require Hole ID,
Depth, and two columns of data.
To create a crossplot log:
Click the Log | Create Log | Crossplot command.
Click inside the log pane where you want the crossplot log to appear.
In the Open dialog, click on the data file. If the data was already opened, click on the table name in the Use Current Table section. Click Open.
Set the data importing options in the Specify Worksheet Column Definitions dialog, if necessary, and click Next.
Finish the importing of data in the Specify Data Type and Column Positions dialog and click Finish.
The log appears in the borehole window.
If you are in active mode a crossplot log is created using the default properties. If you are in design mode, a crossplot log graphic is displayed as a place holder after step 2.
To change the features of a crossplot log, including the data columns used to create the logs, click on the crossplot log in the Object Manager or view window. The properties are listed in the Property Manager.
To change the columns associated with each curve, click on the Log tab in the Property Manager. Set the overlapping fill properties on the Fill tab.
The following tabs are listed in the Property Manager:
See Also