Zone bar logs can display both text
and colors to represent separate zones.
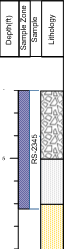
In this example, two zone bar logs are combined with a lithology and depth log.
Click the Log | Create Log | Zone Bar command to create a log that is filled rectangles along the length of the borehole. Zone bars can display a wide variety of logging data. For example, zone bars can represent sample intervals, alteration zones, contamination layers, etc. They also provide a mechanism to display simple keyword text objects either with or without background fill.
|
|
|
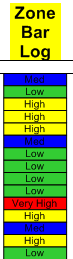
Zone bar logs can display both text and colors to represent separate zones. |
In this example, two zone bar logs are combined with a lithology and depth log. |
Zone bar logs use interval data tables. In the data table, there are four required columns. The required columns are Hole ID, From, To, and the data column being displayed. The data column should contain text for each depth interval row. The text can be mapped to a keyword scheme. Bars are plotted the full width of the zone bar log and extend vertically over the interval: From the top depth and To the bottom depth.
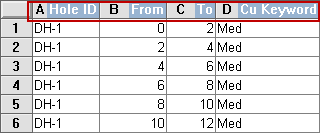
The Hole ID, From, To, and one column of data
are required for a zone bar log.
To create a zone bar log:
Click the Log | Create Log | Zone Bar command.
Click inside the log pane where you want the zone bar log to appear.
In the Open dialog, click on the data file. If the data was already imported, click on the table name in the Use Current Table section. Click Open.
Set the data importing options in the Specify Worksheet Column Definitions dialog, if necessary, and click Next.
Finish the importing of data in the Specify Data Type and Column Positions dialog and click Finish.
The log appears in the borehole window.
If you are in active mode a zone bar log is created using the default properties. If you are in design mode, a zone bar log graphic is displayed as a place holder after step 2.
To change the features of a zone bar log, including the data column used to create the log, click on the zone bar log in the Object Manager or view window. The properties are listed in the Property Manager.
The following tabs are listed in the Property Manager:
See Also