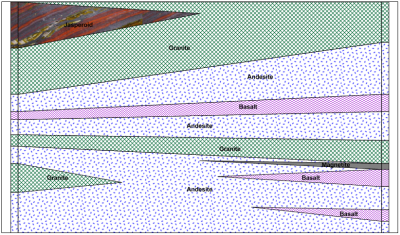
Cross section views display multiple wells on a page. Cross sections can be created from zone bar, lithology, or line/symbol log types. Other log types can be added to the display, similar to a borehole view, but these logs are not included in the automatic cross section connections.
Wells can be automatically connected to display layers, zones, or lithologies from a table view, connecting information from the wells across the page. The wells can also be displayed without connections or with manual connections, connecting the wells where you select.
Wells can be displayed vertically or with deviations calculated from Inclination (or Dip) and Azimuth columns from a table. Well spacing and elevation hanging can be altered to give you the look you need to display your data.
The cross section view also allows data to be exported to a data file for use in Surfer or exported to a Voxler 3D display to create a fence diagram. Drawing objects, labels and other logs can be added to a cross section view.

This cross section displays two wells and the layers between.
Click the File | New |
Cross Section View command, click the  button,
or right-click in the View Manager
and choose New Cross Section View
to add a new blank cross section view to the existing project.
A new cross section view window can also be created with the Cross Section | Create/Add | Create Cross Section command.
Existing cross section views are opened by clicking the appropriate Cross Section tab, checking the box next to the cross section view name in the View Manager, or by selecting Window | [Cross Section name]. By default, the first cross section view is named Cross Section 1 so this cross section view would be opened by choosing the Window | Cross Section 1 command.
Drawing objects and inserted map layers can be added to a cross section view.
See Also