Creating and Editing a Line/Symbol Cross Section
To create a line/symbol cross section, click the Cross Section | Create/Add | Create Cross
Section command. The program will step you through the process
of importing data and selecting the wells to display in the cross section.
Creating a Line/Symbol Cross Section
To create a cross section in Strater:
Click
the Cross Section | Create/Add |
Create Cross Section command.
Select
the collars table:
If a single collars
table exists, it is automatically selected.
If multiple collars
tables exist, select the appropriate collars table in the Look
for Well Locations dialog and click OK.
If no collars table
exists, select the file that contains the collars information
in the Open Collars File
dialog and click Open.
For example, select Example
Data.xls from the Samples folder and click
Open.
In
the XLS Import Options
dialog, select the Collars
sheet and click OK.
In
the Specify
Worksheet Column Definitions dialog, make sure that Specify Column Header Row
is checked and that the row number is set to 1. Click Next.
In the Specify
Data Type and Column Positions dialog, make sure that
all columns are listed correctly. Click Finish.
At
this point, a map view is created with the wells in the collars table.
In the Create Well Selector
dialog,
Set the order the
wells are displayed in the list on the right side of the dialog.
The first well listed is on the far left side of the cross section.
The last well listed is on the far right side of the cross section.
Wells are displayed in the cross section in the order listed on
the right side of the dialog. To rearrange the order, click on
a well on the right side of the dialog and drag it to the desired
location in the list.
To add wells to the
cross section, click on the well name on the left side of the
dialog in the Available wells
list. Click the Add button
to add the well to the right side of the dialog.
To remove wells from
the cross section, click on the well name on the right side of
the dialog in the Wells in selector
list. Click Remove
to remove the selected well.
When all the wells
are in the proper order, click OK.
The wells should be listed as DH-1 first and then DH-2 for this
example. After clicking OK,
the well selector line is created in the map view.
In the
Import
Cross Section Data dialog,
Set the Cross
section log type to Line/Symbol
log.
Click the Import
Data button for DH-1.
In the Import
Data dialog, select the Example
Data.xls file and click Open.
In the Multi-Sheet
Selection dialog, select the Depth
sheet and click OK.
In the Specify
Worksheet Column Definitions dialog, make sure that Specify Column Header Row is
checked and that the row number is set to 1. Click Next.
In the Specify
Data Type and Column Positions dialog, make sure that all
columns are listed correctly. Click Finish.
Since both logs now
have a Table and Data Column defined, click
OK.
Click OK.
In
the Import
Layer Marks dialog,
Check the Specify
layer data check box if you wish to include layer
marks from the layer marks table or tables.
Set the Table
for each Hole ID to the
layer marks table. Layer marks tables are depth tables containing
depths for the tops (or bottoms) of layers.
Set the Data
Column for each Hole
ID to the layer column in the layer marks table.
Click OK.
The default cross
section is created. Because the cross section was created from Line/Symbol
log, the logs are
displayed showing only the line/symbol logs and no layers are created.
If Lithology/Zone
bar log had been
selected in step 4a,
the logs would be displayed showing the wells that were selected and the
connected layers between the wells in the cross
section would also be displayed.
Connecting Wells
With line/symbol log cross sections, wells are manually connected by
using layer marks. Layer marks can be created in another program, such
as Excel and imported into the cross section. Or layer marks can be selected
directly on the line/symbol logs displayed on the cross section. To
manually click each layer
mark:
Click
on the Cross Section object
in the Object Manager.
Click
the Cross Section | Layer Marks | Create/Edit
command to start picking locations on each log where a layer should
be located. The cursor changes to  .
.
Click
on either log in any locations to make a layer mark. Generally, the
top or bottom of the layers should be clicked to create a data file
of tops. As the mouse hovers over a log, the log name and depth appear
in a large box beside the log. This makes it easier to select the
precise location of each layer mark.
After
clicking on the log, the Name
The Layer dialog appears. Type a name for the location
where you clicked, such as Layer
1, or the actual name of the layer. Click OK
in the dialog after naming the location.
Continue
clicking on each log in the cross section to assign the layer top
or bottom locations. Not all layers need to be assigned for each well,
but in order for the wells to be connected some of the same layer
names should be assigned to each log in the cross section.
If
the area from the top of the well to the first layer should be filled,
be sure to click on the top of each well and assign a layer name,
such as Top, Overburden,
or KB.
If
the area below the last layer should be filled, be sure to click on
the bottom of each well and assign a layer name, such as End.
If
a location is selected incorrectly, right-click on the same location
to remove the layer mark.

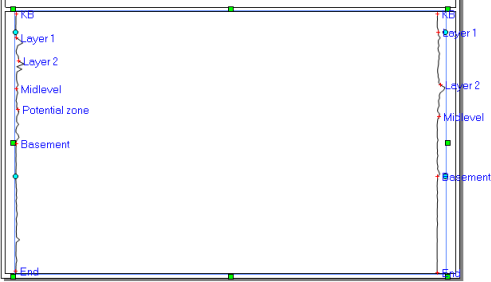
After clicking a few layer marks on each log, your
cross section may look something like this.
After
selecting all layer marks, press ENTER on the keyboard to end layer
mark creation/editing mode.
In
the Save Layer Marks
To Table dialog, check the Save
layer marks to table option to save the marks to a table. You
can select any of the existing tables, or type a new table name next
to Table name. Click OK and
the layer marks are saved to the table.
Click
Yes in the warning message
which indicates that the cross section will be redrawn. The layer
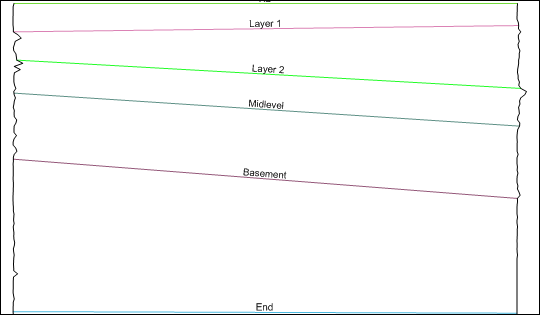
marks are now connected across the logs.

The layer marks are now connected across the logs. Layer
labels have
been added by checking the Show
Layer Labels option in the Property
Manager.
Notice
that the Potential zone layer
mark on DH-1 does not have a layer. This is because the same mark
does not exist on DH-2. A new layer can be created named Potential
zone. With the Cross Section
object selected, click the Cross
Section | Create/Add | Connect Logs with Layers command.
In
the Select Or Enter
Layer Name dialog, click on the existing name and select Potential zone from the list. Click
OK.
Click
on the DH-1 log near where the Potential
zone layer mark was created.
Hold
down the SHIFT key and click on locations between the two logs to
make a pinchout layer.
Click
on the DH-1 log above the Basement
layer line.
Press
ENTER on the keyboard or double click the last point to end the layer
creation mode. A Potential zone
layer is created and automatically filled.
To fill
the rest of the layers, make sure that the Layers
object is selected in the Object
Manager. In the Property Manager,
click on the Layers tab and check
the box next to Fill between Layer
Lines.
Since
the Potential zone layer
was created before filling the layers, it is now at the bottom of
the list of layers in the Object
Manager. Click on the Potential
zone layer and click Arrange
| Move | To Front.
To change
the colors of the layers, the scheme can be edited. Click the Home
| Display | Scheme Editor command.
Open
the Cross Section Scheme
by clicking on the  next to Cross
Section Scheme.
Click
on the first item in the scheme. Assign fill colors and properties.
Repeat
steps 19 and 20 for each additional item in the scheme. When the scheme
colors are set appropriately, click OK
to close the Scheme Editor.
When
all edits have been made, the layer lines can be unchecked in the
Object Manager. This
leaves only a single label in the center of each layer. The cross
section may look like the following.

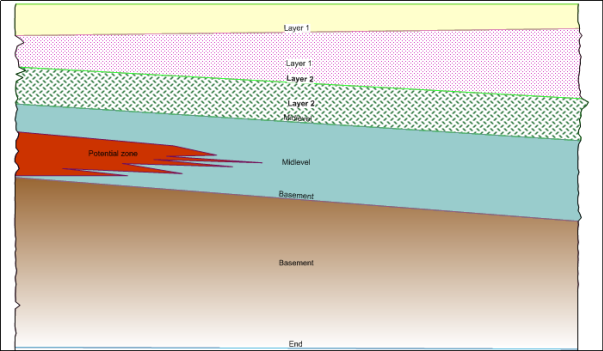
After editing the layer colors and label properties,
the final cross section may look like this.
See Also
Creating
a Lithology/Zone Bar Cross Section
Creating
a Depth-Registered Raster Cross Section
Cross
Section View
Map
View
Well
Selector
Collars
Table
Table
Types
 .
.

 next to