Three-Minute Tour
We have included several example files with Strater so that you can quickly see some of Strater’s capabilities. Only a few example files are discussed here, and these examples do not include all of Strater’s many log types and features. The Object Manager is a good source of information as to what is included in each file.
To see the sample Strater files:
Open Strater.
Click the File | Open command.
Click on a .SDG file located in the Samples folder. By default, the Strater Samples folder is located in C:\Program Files\Golden Software\Strater 5\Samples.
Click Open and the file opens.
The primary graphical component to a document is a borehole view. A borehole view is either based on a template file or created from scratch by adding the necessary log, header and footer items. Boreholes views, map views, and cross section views display logs, well and base maps, and cross sections of the selected data when the tab is selected. When a data table tab is selected its data appears in the workspace.
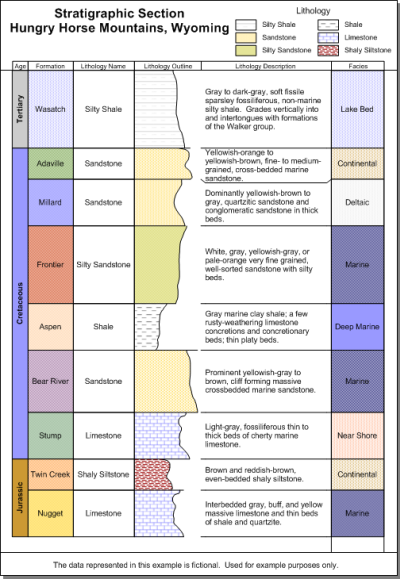
The Lith Section-1.sdg sample file contains a sample lithology log column. Age, formation, lithology type, and lithology description appear in the borehole view. Four data tables are included in the .SDG file and include the information being displayed in the borehole view.
The Lith Section-1.sdg file contains
several zone bar logs and a lithology log.
The Example Logs.sdg sample file contains every type of log file that Strater can create. Click on a log and the Property Manager updates to show only that log’s properties. Experiment with the properties for the logs to see how the log changes. Click on the map and cross section tabs to experiment with the properties for the map and cross section views.
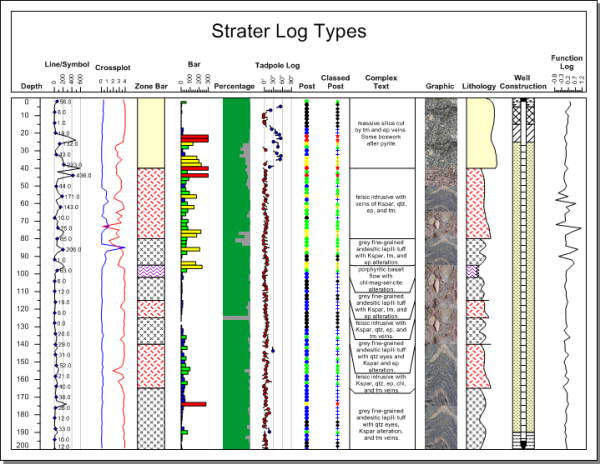
The Example Logs.sdg file displays an example of each log type in the same borehole view.
One purpose of the sample files is to discover the effects of changes made in the Property Manager – to experiment so that the functionality is closer to second nature and you do not need to search for the correct setting. Use these sample files, especially this file, to discover the breadth of options available. If you want to save any changes we recommend keeping the original file and using the File | Save As command to save a copy of the file to a new name.
The general steps to progress from a data file to a borehole are as follows.
Open Strater.
Click
the File | Open command or
click the  button.
In the Open dialog, select the data file and click the Open button. For this example, the data should have From and To columns because of the type of log created. The sample Tutorial 1.xls file can be used with the Lithology sheet.
In the Specify Worksheet Column Definitions and Specify Data Type and Column Positions dialogs, set the column names and rows to import. The data opens into Strater and is displayed in a table view.
Click on the Borehole 1 tab.
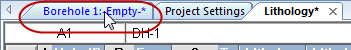
Click on the Borehole 1 tab.
Click the Log | Create Log | Depth command to create a depth log.
Click on the screen in the location where you want the depth log to be displayed.
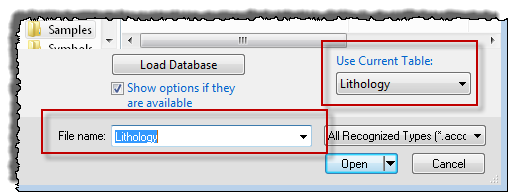
In the Open dialog, verify that Use current table is selected and click Open. The depth log is displayed.
Verify that the table is selected.
Click the Log | Create Log | Zone Bar command to create a zone bar log.
Click on the screen where you want the zone bar log to be displayed.
In the Open dialog, verify that Use current table is selected and click Open. The zone bar log is displayed.
Click the File | Save As command. Enter a File name in the Save As dialog and click the Save button to save your Strater project.
To proceed from the borehole to a map view and cross section view, these steps are used.
Click the Home | New | Map View command to create a new blank map window.
Click the Map | Create | Well Map to display the wells on the map. Select and open a collars table, if prompted. The sample Example Data.xls file can be used with the Collars sheet.
Click on the Wells layer in the Object Manager.
Click the Map | Add | Well Selector command.
Click on the wells in the order they should appear in a cross section.
Click the Home | New | Cross Section View command to create a new blank cross section.
Click the Cross Section | Create/Add | Create Cross Section command to create the default cross section from the well selector.
See Also