The data, scheme, and log, map, or cross section properties are all related in the process of creating a log in a borehole view or cross section view, creating a map Wells layer, or creating layers in a cross section. The data contains depth information (either single depth or from-to interval depth), borehole names, and the data to be displayed on the log. Schemes contain line, symbol, label, and fill property information that links the data to the log. When scheme information (keywords or numeric ranges) is found in the data, the logs in the borehole or cross section displays the properties of the scheme. The Property Manager determines which data table and column are used to create the log, the scheme to use (if any), and properties such as the log width. Each log item can use a different data table, column, scheme, and properties.
Project data, schemes, and log properties are all related in the process of creating a borehole log.
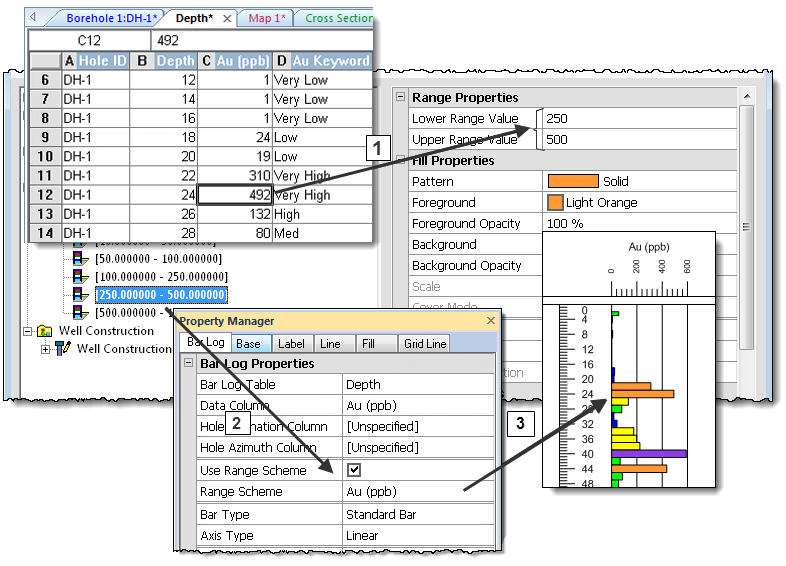
The data in each row is linked to a scheme item. This scheme links the Au (ppb) values from column C. In this case, the data in row 12 has a value of 492 and appears at a depth of 24. The data in row 12 falls within the range scheme item of 250 to 500. Note the fill is a solid light orange.
A bar log is created displaying the Au (ppb) data column. The Au Concentration scheme is selected.
The bar log is displayed. The Au Concentration scheme determines the appearance of the log. The color at the depth 24 is light orange, as indicated by the scheme.
This diagram shows the connection between a value in the table column, the scheme, and the log being displayed.
See Also