Line/symbol logs display table data vertically at a depth value and horizontally at a data value. Lines, symbols, or both lines and symbols can be displayed.
To create a line/symbol log:
Click the Log | Create Log | Line/Symbol command.
Click in the log pane in the location you want the line/symbol log drawn. For this tutorial, click near the center of the log pane. You will position the log item more exactly later.
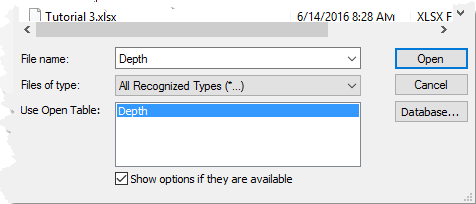
In the Open dialog, make sure that Depth is selected in the Use Open Table option and in the File name box.
Select the Depth table in the Use Open Table section and
make sure it is selected in the File name box.
Click Open.
The line/symbol log is created with the default properties.
Note that a scale bar appears in the header pane. The default option for line/symbol logs is to always create a scale bar. The scale bar shows the range of values for the variable being displayed. If scale bars are not desired by default, click the File | Options command. Uncheck the box next to the Auto Create Scale Bar option in the General section.

The borehole view should look similar to
this, after adding the line/symbol log. Both the
depth log and line/symbol log are shown,
with the scale bar above the line/symbol log.
Back to Creating a Depth Log
Next to Creating a Zone Bar Log