Click
the Home | New | Map View
command or click the  button to open a new map view.
Click the Map | Create | Well Map command to create a new well map layer.
To create the deviated boreholes in the map view, a new map view must be created with the wells map layer. The properties of the wells layer are then edited to display the deviations from the survey table.
Click
the Home | New | Map View
command or click the button to open a new map view.
Click the Map | Create | Well Map command to create a new well map layer.
The wells map is created, showing a point at each well location on the map.
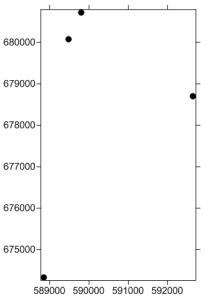
The map is created with the well locations
for each well in the collars table.
Once the map is created, the wells layer can be edited to show the deviations.
Click on the Wells 1 layer in the Object Manager to select the well map layer.
In the Property Manager, click on the Wells tab.
Check the box next to the Show Deviation Path option.
Click the empty box next to Deviation Table and select [Survey Table].
To show the well labels, click on the Label tab.
Click on the [None] option next to Label 1 and select Hole ID. The borehole names are added to the map.
The wells map updates to show the deviation on the two center wells. The far right T-45 well's deviation path is outside the limits of the map. To update the limits,
Click on the Map 1 object in the Object Manager to select the entire map.
Click on the Limits tab in the Property Manager.
Click the Fit All button next to the Fit All command. All of the wells and their deviations are displayed.
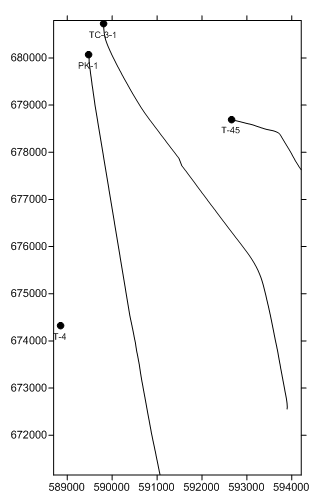
The well locations and deviation paths are displayed in the map view.
Back to Displaying Deviated Boreholes in Maps and Cross Sections