Axes can display both major and minor ticks. When a map is created, the display of major ticks is on by default. Major ticks display tick labels along the axis. Minor ticks on an axis are not represented with a tick label, and are not drawn on an axis by default. Minor ticks are defined as the number of minor ticks to be drawn between adjacent major ticks.
The Ticks page controls the display of major and minor ticks, the position, and length of ticks.
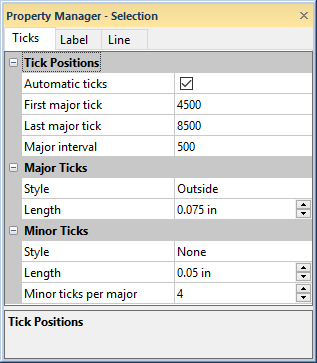
Specify the axis tick properties in the
Property Manager on the Ticks page.
Axes are a part of the map on which they are placed. Axes are drawn
at the edge of the map, covering the entire limits of the map. To set
the tick positions to custom values, click the  next
to Tick Positions to open
the Tick Positions section.
next
to Tick Positions to open
the Tick Positions section.
The Automatic Ticks option uses the limits of the map as the limits for the axes and uses a reasonable tick mark spacing along the axis. When any parameters in the Tick Positions section are changed, the Automatic Ticks check box is automatically unchecked. After making any changes, you can return to the automatic settings by checking the Automatic Ticks box.
The First Major Tick option controls the major tick mark minimum value. This value is expressed in data units. The First Major Tick does not need to be the same as the map minimum value, but it cannot be less than the minimum value. To set the tick value, highlight the existing value and type a new value. Press ENTER on the keyboard to make the change.
The Last Major Tick box controls the major tick mark maximum value. This value is expressed in data units. The Last Major Tick does not need to be the same as the map maximum value but it cannot be greater than the maximum value. To set the tick value, highlight the existing value and type a new value. Press ENTER on the keyboard to make the change.
The Major Interval option controls the spacing, in data units, between major ticks along the selected axis. The major tick marks occur at values
Tick = First major tick + n* Major interval n = 0, 1, ..., N
where N is the largest integer such that Tick ≤ Last Major Tick. Thus, a tick mark is placed at the value of the Last Major Tick only if the interval (Last Major Tick - First Major Tick) is evenly divisible by Major Interval. To change the interval, highlight the existing value and type a new value.
The Major Ticks section controls
the display of the major tick marks. Click the next
to Major Ticks to open the Major Ticks section.
Click the Style option to display a list of available styles for the tick marks. In the list, select the desired tick mark location. Options include None, Outside, Inside, and Cross. If you do not want to display ticks, select None from the list. Outside places the ticks on the outside of the axis. Inside places ticks on the inside of the axis (in the map area). Cross places ticks on both the outside and inside of the axis.
The Length option controls
the length of the major tick marks. The tick lengths are in page units.
To change the length, highlight the existing value and type a new value
or click the ![]() to increase or decrease the value.
to increase or decrease the value.
The Minor Ticks section controls
the display of the minor tick marks. Click the next
to Minor Ticks to open the Minor Ticks section.
Click the Style option to display a list of available styles for the tick marks. In the list, select the desired tick mark location. Options include None, Outside, Inside, and Cross. If you do not want to display ticks, select None from the list. Outside places the ticks on the outside of the axis. Inside places ticks on the inside of the axis (in the map area). Cross places ticks on both the outside and inside of the axis.
The Length box controls the
length of the minor tick marks. The tick lengths are in page units. To
change the length, highlight the existing value and type a new value or
click the ![]() to increase or decrease
the value.
to increase or decrease
the value.
To specify the number of minor ticks to draw between adjacent major ticks, enter the number into the Minor Ticks Per Major box. This should be one less than the number of minor divisions you want to appear between adjacent major ticks. Specify a value between 1 and 20.
For example, if you want the minor ticks to indicate 2 divisions, the Minor Ticks Per Major value should be set to 1.
See Also