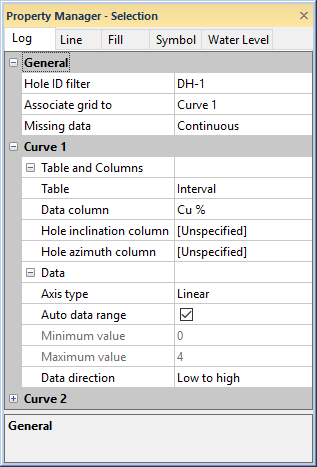
The Log page in the Property Manager includes options for defining which curve to associate with the grid, how to display missing data, and the tables and data for the curves in crossplot logs. To view and edit crossplot log properties, click on the crossplot log in the view window or Object Manager to select the log. Then, click on the Log tab in the Property Manager.
Edit crossplot log properties on the
Log tab in the Property Manager.
The Hole ID filter is used to select the borehole to associate with this log. Only those Hole IDs that are currently associated with data tables in this project are listed. To change the Hole ID Filter, click on the existing Hole ID and select the desired Hole ID from the list. The log automatically updates to show the new borehole.
When the Logs object is selected in a cross section view, the Hole ID filter is not available. To set a specific log to a particular Hole ID, click on that individual log and set the Hole ID filter to the appropriate log.
The Associate grid to option determines which curve is associated with both the grid lines and the scale bar for this log. Select either Curve One or Curve Two.
The Missing data option controls how rows of empty data are displayed on the log. Set Missing data to Continuous to show rows of missing data as a continuous line between the data values on each side of the missing data. Select Discontinuous to show the missing data as a gap in the line of the log. To set the missing data option, click on the existing option and select the desired option from the list.
The Curve 1 and Curve
2 sections of the Log page
contain the table, column, and data properties for the two curves in the
crossplot log. Each section contains the same properties. Click the  button to expand the sections.
Use the Table to define the data table for the curve. The table type can be an interval table or a depth table. If the table is a depth table, the points are plotted at the depth listed in the table. If the table type is an interval type table, the depth is determined by calculating the mid-point position between the To and From columns in the corresponding table. To change the table, click on the existing table name and select the desired table from the list.
The Data column is the column in the selected Table that is being displayed by the curve. When the Table is changed to another table, the Data column list is automatically updated to display the column names in the newly selected table. To change the column, click on the existing column name next to Data column and select the desired column from the list.
The Hole inclination column (or Hole dip column) is used in combination with the Hole azimuth column to calculate the true vertical depth for the hole. Either Hole inclination column or Hole dip column is displayed. To control whether inclination or dip is used, click the File | Options command. In the Options dialog, check or uncheck the Use Hole dip instead of inclination option.
Inclination is the angle the borehole is oriented in degrees and varies from 0 to 180. 0 indicates vertical pointing down, 90 indicates horizontal, and 180 indicates vertical pointing up. Negative and positive inclination values are treated the same for depth calculations. Negative inclination values are treated differently for well path calculations in the cross section and map views. A negative inclination changes the direction (azimuth) to the opposite of the similar positive inclination. For example, the azimuth value of 90 and inclination of 45 describes the same orientation as the azimuth value of 270 and inclination of -45 degrees. Both combinations describe an eastward direction at 45 degrees down from the horizontal plane.
Dip is an alternate method of calculating the angle the borehole is oriented. Dip is oriented in degrees and varies from -90 to 90. -90 indicates vertical pointing down, 0 indicates horizontal, and +90 indicates vertical pointing up.
Azimuth is the compass orientation of the well's deviation, in degrees and varies from 0 (true vertical north) to 360. Azimuth values are measured relative to true north (not grid north in the local coordinate system).
To set the Hole inclination column or Hole dip column, click on the existing option and select the desired option from the list. Available options are [Unspecified], [From collars table:collars name], [From survey table: survey name], or data columns in the selected Lithology table. When one column is set to unspecified or survey table, the other column automatically changes to the same option. When recorded in a collars table, the inclination/dip and azimuth apply to the entire well length. When recorded in a survey table, the inclination/dip and azimuth apply from the depth to the next recorded depth. When set to one of the columns in the existing table, each log is updated independently from each other log using the information in the specific depth or interval tables. If the Hole inclination column for the log is set to [Unspecified], an inclination value of 0 is used for the calculations. No difference will be visible for the log when changing the Depth method to True vertical depth.
The Axis type is Linear or Logarithmic. The data must be greater than zero when using a Logarithmic axis. Values equal to and less than zero are ignored in the log when Logarithmic is selected. Logarithmic uses a log (base 10) scale for the horizontal axis. To change the axis type, click on the existing option and select the desired option from the list.
The horizontal scale can be set manually or automatically with the Auto data range option. Check the Auto data range check box to calculate a best-fit range of the data. When Auto data range is not checked, the Minimum value and Maximum value properties are enabled allowing manual control over the log's minimum and maximum values. To change the data range, check or uncheck the Auto data range check box.
The Minimum value and Maximum value are only available if the Auto data range is not checked. The Minimum value is the smallest value that should be displayed on the log. The Maximum value is the largest value that should be displayed on the log. To change the minimum and maximum values, highlight the existing value in Minimum value or Maximum value field and type the desired value.
If the borehole is changed, the new data may or may not fit into the user-defined range. If the data does not fit inside the range, change the Minimum value and Maximum value to new values or check the Auto data range check box.
The Data direction is used to determine whether data should be displayed with low values on the left or right side of the log. Available options are Low to High and High to Low. Low to High creates a log with the minimum data value on the left and the maximum data value on the right. High to Low creates the log with the minimum data value on the right and the maximum data value on the left. To change the direction, click on the existing option and select the desired option from the list.
By default, curve one uses a data direction of low to high and curve two uses a data direction of high to low.
See Also