Kolmogorov-Smirnov Goodness of Fit for Normal Distribution
The Kolmogorov-Smirnov statistic is the largest difference between an expected cumulative probability distribution and an observed frequency distribution. The expected distribution used here is the normal probability distribution with mean and variance equal to the mean and variance of the sample data. The observed frequency distribution is a stepped function that increases by 1/n with each step, where n is the number of values in the data set.
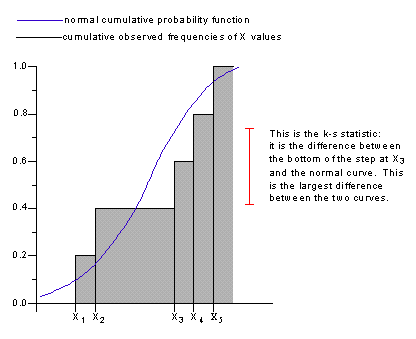
For example, suppose that there are five values in a data set. The observed frequency distribution is 0 to the left of the first data point. At the first data point the observed distribution function jumps to 0.2 (since there are five data values, the size of the step at each value is one divided by five). At each successive data value the observed frequency distribution jumps by 0.2.
The K-S statistic is calculated as the largest difference (in absolute value) between the normal cumulative probability function and the observed frequency distribution, as shown below. Note that at each step it's necessary to compute the difference between bottom of the step and the normal curve and also between the top of the step and the normal curve.

See Also
95% and 99% Confidence Interval for the Mean
Critical Value of K-S Statistic at 90%, 95%, and 99% Significance Level