Strater imports multiple PDF pages as separate images. You can use Strater to create a single image from the multiple pages before using the file to create an unregistered raster log. Generally, the process is performed in four steps. First, create a base map with the PDF file. Next, align the pages correctly using the spatial references. Third, export the image. Finally, create the raster log. The following steps provide the process for going from a multi-page PDF to a raster log.
The first thing we need to do is create a base map from the PDF file.
Create a new map view in your project by clicking the Home | New | Map View command.
Create a new base map by clicking the Map | Create | Base Map command.
Select your PDF file in the Import dialog.
Click Open.
In the PDF Import Options dialog, select a Render resolution or specify a custom resolution. Make a note of the resolution you select.
In the PDF Import Options dialog, select the Import all pages button.
Click OK.
Now the PDF is imported as a base map. Each page is a separate image in the base layer. The pages are imported in order from the first page to the last page. This order is reflected in the Object Manager. Only the last page will be visible, as the images are all overlaid because they share the same spatial extents.
Next we create a table to give us the correct spatial extent values. These steps will explain how to create the table in Strater. At the end of this section, a similar process will be explained for using Excel. You may wish to create the table in a new Strater instance or in Excel. Later, you will have to read the table values and type them into the Property Manager. This will require fewer clicks if each window is in a separate monitor or if the application widows are tiled on the same monitor.
In your map view, click on the topmost image in the Base 1 object in the Object Manager.
Note the object name, Image #. The number will indicate the number of images. This value will be used to determine the number of rows in the table.
Click the Info tab in the Property Manager.
Note the width and height of the image in the Size (pixels) field. The height value will be used to create the Top and Bottom values in the table. The width will be needed when exporting the map.
Create a table by clicking the Home | New | Table command.
In the Create New Table dialog, select Text Item Table in the Base Table Type list.
Click Create.
Click the Data | Data | Transform command.
In the Transform dialog:
Set Transform with to Column variables (e.g., C = A + B)
Type A = (<height>-1) * (ROW()-1) in the Transform equation field, where <height> = image height from step 4.
Ensure the First row is set to 1.
Type the number of images into the Last row field you noted in step 2.
Click OK.
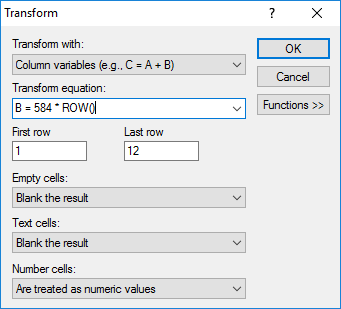
Click the Data | Data | Transform command.
In the Transform dialog:
Set Transform with to Column variables (e.g., C = A + B)
Type B = (<height>-1) * ROW() in the Transform equation field, where <height> = image height from step 4.
Ensure the First row is set to 1.
Type the number of images into the Last row field you noted in step 2.
Click OK.
You can see from this example, the image height is 585 pixels
and the PDF file consisted of 12 pages.
Now we have a table of Top and Bottom values for each image in the base layer. You may wish to create this table in Excel. One method to do so is to type the image height in cell A1. Type =($A$1-1)*(ROW()-1) in cell B1 and auto-fill down until you reach the number of pages. Type =($A$1-1)*ROW() in cell C1 and auto-fill again. Now you have a table of values in Excel.
Next we will use these values to align the images in the correct position in the map view.
Click on the Map 1 tab to return to the map view.
In the Object Manager, click the topmost image under the Base 1 layer.
Click the General tab in the Property Manager.
If necessary,
click the  button to expand the Spatial
Extents section.
button to expand the Spatial
Extents section.
Verify that the Bottom and Top values match the values in the first row of your table, i.e. the Bottom value is 0 and the Top value is the image height minus 1.
Click the next image down in the Property Manager.
Change the Bottom value to the bottom value in row 2 of your table.
Change the Top value to the top value in row 2 of your table.
Repeat steps 6-8 for each image and corresponding row in your table.
Click on the Map 1 object in the Object Manager.
Click the Limits tab in the Property Manager.
Check the Use data limits check box.
Click the Scale tab in the Property Manager.
Change the Y Scale section's Length (page units) property to about 7 or 8 inches (17-20 cm).
If the map is not visible, set the Arrange | Position | Y value to 0. The image will be placed in the page.
Now the page images should be aligned correctly. You can zoom into the map view to verify the image looks correct.
Next we will export the map to a single image for use as a raster log.
Click the Left Axis object in the Object Manager.
Click the Home | Clipboard | Delete command.
Delete the Right Axis, Top Axis, and Bottom Axis in the same manner. Alternatively you may hide the axes by clearing the check boxes in the Object Manager.
Click the Map 1 object in the Object Manager.
Click the File | Export | Graphic command.
Select a File name and location in the Export dialog.
Select an image file type in the Save as type list.
Check the Selected objects only and Show options dialog check boxes.
Click Save.
On the Size and Color page of the Export Options dialog:
Uncheck the Maintain aspect ratio and Maintain pixel dimensions options.
Set the Pixels per inch to the value you used when you imported the PDF.
Set the Width to the width of the images you noted earlier.
Set the Height to the largest value in the top column of your table plus one.
Set the Color depth and Reduction method, if desired.
On the other Export Options dialog pages, make any necessary adjustments to the image export options.
Click OK.
Now you have a single image ready for use with the Log | Create Log | Unregistered Raster command. You may wish to delete the map view and table from your project. They will not be needed now that you have created the single image. This same general process can be used to stitch together multiple images of any file format.
See Also
PDF Adobe Acrobat Portable Document Format [.PDF] File Description