To view the general settings for a borehole view in the Property Manager, click the View | Display | View Properties command, click Arrange | Selection | Deselect All, click on the view name in the View Manager, right-click on the view name in the View Manager and choose View Properties, or click the mouse in any white space in the borehole view that is not part of a log or object.
The borehole view properties in the Property Manager contain the basic settings for the borehole view, including the view name, view data range, scaling, units, display mode, and the associated template name (if any). You can also define the line styles of the panes and define a project null value in the borehole view properties.
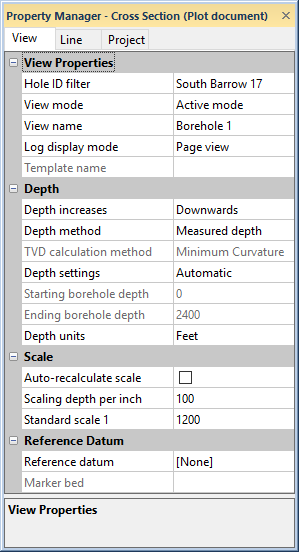
The borehole view properties consists of five tabs: View, Line, and Project.
The View tab contains the borehole and depth options.
Use the View tab to set depth options and the borehole ID.
The Hole ID Filter displays the name of the Hole ID when every log pane item in the borehole view represents a single Hole ID. If there is more than one borehole represented in the logs and you have not selected an object in the log pane, the Hole ID Filter displays -Multi-. To change the Hole ID of all objects in the log pane, click the text next to Hole ID Filter and select the desired Hole ID from the list. When selected, all objects in the log pane will display information based on this selected Hole ID.
When the Hole IDs for all log items in the borehole view are changed to a single Hole ID the Hole ID Filter field automatically changes to reflect the revised single hole ID.
The View mode property controls and displays whether the current project is in design mode or active mode. Design mode is used to create graphics without attaching them to data. Design mode is useful when designing complex logs or when designing templates. When the program is in active mode, the graphics are linked to data as they are being created. To change the View Mode, click on the existing option and select the desired option from the list. Alternatively, toggle back and forth between design mode and active mode with the Log | Design Mode command.
The View Name is the label that appears in the borehole view tab to the left of the colon. Strater projects can contain multiple borehole views, such as monitoring well views and sampling well views. View Name is a way to separate the various views from one another and to clearly identify the view. The default name of the tab is Borehole 1: X, in which X is the current Hole ID Filter (described below). To change the view name, highlight the existing name and type the new desired name of the view in the View Name field.
The Log display mode shows the current borehole in either Page view or Full view.
Page view separates the log into multiple pages with page breaks. The header and footer can be shown on each page, on only the first or last pages, or not at all by setting the display and size of the panes in the Page Setup dialog. If the Log display mode is set to Page view select View | Zoom | Fit Page or click the page buttons to move among the pages.
The Full view shows the header and footer but expands the log pane to show the whole length of the log with no breaks.
The Template Name shows the template name, if any, attached to this borehole view. This is a read-only field.
The Depth increases property tells Strater whether values in the depth column increase down or up. To change the orientation, click on the existing option and select the desired option from the list. Set the borehole orientation to Downwards when the Starting borehole depth is less than the Ending borehole depth. Set the borehole orientation to Upwards when the Starting borehole depth is greater than the Ending borehole depth.
The borehole orientation will automatically change to reflect the current Starting borehole depth and Ending borehole depth. For example, if the borehole orientation was originally set to Upwards and a user changed the start depth to be less than the end depth, the borehole orientation field automatically changes to Downwards.
The Depth increases property is not available when the borehole view includes a raster log.
The Depth method sets the display of the view to either measured depth or true vertical depth. The Measured depth is the depth values from the tables. The True vertical depth is calculated from the depth values in the tables and the azimuth and inclination (or dip) values using the TVD calculation method. To change the depth method, click on the existing option and select the desired option from the list.
All logs except for depth logs are displayed using the specified depth method.
When the Depth method is set to True vertical depth, the displayed depth value is calculated using the depth from the table and the azimuth and inclination (or dip). The TVD calculation method determines how the values are combined to get the true vertical depth. Available options are Tangential, Average Tangential, Balanced Tangential, Radius of Curvature, and Minimum Curvature. The default is Minimum Curvature, which provides a good estimate of the true vertical depth. To change the calculation method, click on the existing option and select the desired option from the list.
The Depth settings option controls the starting and ending borehole depths. There are three options: Automatic, Collars table, and User defined. To change the Depth settings, click on the existing option and select the desired option from the list.
By default, the Depth settings option is set to Automatic. When the Depth settings option is Automatic, Strater scans the existing data tables to determine the starting and ending borehole depths that will fit all data.
When the Depth settings option is set to Automatic and the Depth method is set to True vertical depth, the deviation field in the depth or interval table is used to calculate the overall true vertical depth. If the deviation field is missing from the depth/interval table, then the deviation field from the collars table is used. If the deviation field is missing from the collars table, the deviation value of 0 is used.
When the Depth settings option is set to Collars table, the starting and ending borehole depths are retrieved from a collars table. You can also specify the scale of the borehole view in a collars table. Select a borehole in the Hole ID Filter list to update the Automatic and Collars table selections.
When the Depth settings option is set to Collars table and the Depth method is set to True vertical depth, the deviation field in the collars table is used to apply the starting and ending depths. If the deviation field in the collars table is missing, the deviation value of 0 is used.
When the Depth settings option is set to User defined, the Starting borehole depth and Ending borehole depth are available.
When the Depth settings option is set to User defined and the Depth method is set to True vertical depth, the deviation field in the depth or interval table is used to calculate the overall true vertical depth. If the deviation field is missing from the depth/interval table, then the deviation field from the collars table is used. If the deviation field is missing from the collars table, the deviation value of 0 is used.
If the Depth settings option is set to User defined, you can specify the starting borehole depth. The Starting borehole depth is the depth to begin the data display. If the Starting borehole depth is greater than zero, the Ending borehole depth must be greater than the starting value. Likewise, if the Starting borehole depth is less than zero, the Ending borehole depth must be less than the starting value. If the Starting borehole depth is zero, the Ending borehole depth can be either negative or positive.
If the Depth settings option is set to User defined, you can specify the borehole range. The Starting borehole depth is the depth to begin the data display and the Ending borehole depth is the ending depth for data display. If the Starting borehole depth is greater than zero, the Ending borehole depth must be greater than the starting value. Likewise, if the Starting borehole depth is less than zero, the Ending borehole depth must be less than the starting value. If the Starting borehole depth is zero, the Ending borehole depth can be either negative or positive.
Select the borehole unit type from the Depth units list. The units selected here are the units of the data in the data table and are the base units for the depth log.
Uncheck the box next to the Auto-recalculate Scale option if you want to manually adjust the Scaling Depth per Centimeter/Inch and the Standard Scale 1 fields. Check the box next to Auto-recalculate Scale to not edit these fields. Strater will automatically calculate the scale of the log display so that all data fits on a single page. When these are automatically set by checking the Auto-recalculate Scale option, the entire borehole fits in a single page.
Use the Scaling depth per inch (or centimeter) to scale the borehole in units of measurement on the physical page. This value must be greater than zero. The page length limit is 2000 inches. To change the units between inches and centimeters use the general settings in the Options dialog.
The Standard scale 1 displays the ratio between the scale depth per inch and the depth units you select. For example, if the Scaling depth per inch is set at 2 and the depth units are Feet the standard scale automatically displays 24, which is the number of inches per unit of depth (12 inches in a foot) multiplied by the scale depth per inch (2).
If you change the standard scale 1 number, the scale depth per inch automatically changes as well. For example, if you change the standard scale 1 number from 24 to 36 the scale depth per inch value changes to 3. If you change the depth unit to meters the standard scale value changes to 118.11, which is the number of inches in 3 meters.
The Reference datum is the surface on the earth that defines the vertical reference for all wells in the borehole view. Changing the reference datum results in the logs in the borehole view being regenerated and "hung" on a different marker. The logs hang on an imaginary horizontal line that runs across the borehole view. The reference datum follows this horizontal line. To change the Reference datum, click on the existing option and select the desired option from the list. Available options are [None], Mean sea level, and Marker bed. Selecting [None] plots all logs at the starting depth. Elevations are not considered. Mean sea level places sea level (elevation = 0) on the horizontal line. All other locations vary based on depths and elevations from seal level. The wells in the borehole view will be placed at their respective elevations, as entered in the collars table. Marker bed places the horizontal line at the top of the selected layer in the borehole view.
If Reference datum is set to Mean sea level or Marker bed and the Depth settings is set to Collars table, the Starting borehole depth and Ending borehole depth values will be adjusted to account for the elevation. That is, the Starting borehole depth equals the Elevation minus the Starting Depth. For example, if the Elevation is 1000 and the Starting Depth is 700 in the collars table, the Starting borehole depth will be 300 (1000-700=300).
If you change the Reference datum to either Mean sea Level or Marker bed and if the Depth settings are set to User defined, the Starting borehole depth and Ending borehole depth values will not be updated. This may result in parts of the borehole view being created off the visible page.
When the Reference datum is set to Marker bed, the Marker bed option becomes available. This is the level in the borehole view that defines how all logs are compared. The marker bed is the bed that is at the same vertical location across the borehole view and all logs.
Use Line page to adjust the line properties for the lines that surround the header, log, and footer panes and the end depth line. Check the Show end depth line check box to add a horizontal line at the log end depth.
This option allows you to store a null value with the Strater file .SDG, and this value can be different from the null value set in File | Options. This NULL data value setting overrides the null value in File | Options.
See Also