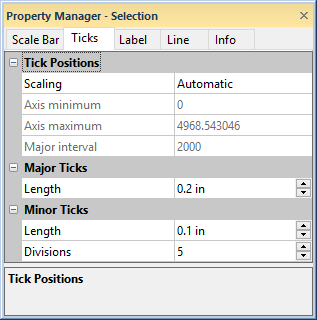
The Ticks page in the Property Manager includes options for setting the tick scaling, interval, and length of the ticks for a scale bar. To view and edit scale bar tick properties, click on the scale bar in the view window or Object Manager to select the scale bar. Then, click on the Ticks tab in the Property Manager.
Set the scale bar tick properties on the
Ticks tab in the Property Manager.
The Scaling option is only available when the Type is set to Cross Section on the Scale Bar tab. The Scaling controls how tick marks appear on the scale bar. To change the Scaling, click on the existing option and select the desired option from the list. Available options are Automatic and User Interval. Set the Scaling to Automatic to automatically define the starting and ending ticks, based on all of the logs in the cross section. Set the Scaling to User Interval if you want the tick range calculated automatically, but want to set the Major Interval to a custom value.
To set the Axis Minimum or Axis Maximum, click on the Scale Bar tab and set the Type to User Defined. Then, click on the Ticks tab and set the Axis Minimum and Axis Maximum values.
To control the Axis Minimum, Axis Maximum, and Major Interval for a log linked scale bar, click on the log and click the Grid Line tab. Set the Grid Minimum, Grid Maximum, and Grid Interval in the in the Variable Grid Lines section.
When the Scale Bar Type is set to User Defined, you can enter an Axis Minimum and an Axis Maximum. The Axis Minimum must be less than the Axis Maximum. To change the Axis Minimum or Axis Maximum value, highlight the existing number and type the desired value. Press ENTER on the keyboard to make the change.
To control the minimum and maximum values for a scale bar linked to a log item, click on the log to select it. In the Property Manager, click on the log's Grid Line tab. In the Variable Grid Lines section, set the Scaling to User Defined. Then, set the Grid Minimum or Grid Maximum values to the smallest and largest values that should be shown on the scale bar. The scale bar updates and the log only displays the points that are within the range.
When the Scale Bar Type is set to User Defined or Cross Section and the Scaling option is set to User Defined, use the Major Interval setting to control the spacing between major tick marks. The interval value is in the same units as the Axis Minimum and Axis Maximum. The interval must be greater than zero. A Too many intervals warning message appears is the number typed in the Major Interval creates more than 1000 tick marks on the scale bar. To change the interval, set the Scaling option to User Defined. Then, highlight the existing value next to Major Interval and type the desired number. Press ENTER on the keyboard to make the change.
To control the major interval for a scale bar linked to a log item, click on the log to select it. In the Property Manager, click on the Line tab. Change the Scaling to User Defined. In the Show Major Variable Grid Lines section, set the Grid Interval to the desired major interval. The scale bar updates.
The length of the major tick marks is set in the Major Ticks section with the Length option.
Values are in page units and range between 0.0 to 2.0 inches (0 and 5.08
centimeters). To change the value, highlight the existing value and type
the desired length. Press ENTER on the keyboard to make the change. Alternatively,
click the ![]() to increase
or decrease the tick length.
to increase
or decrease the tick length.
The length of the minor tick marks is set in the Minor
Ticks section
with the Length option.
Values are in page units and range between 0.0 to 2.0 inches (0 and 5.08
centimeters). To change the value, highlight the existing value and type
the desired length. Press ENTER on the keyboard to make the change. Alternatively,
click the ![]() to increase
or decrease the tick length.
to increase
or decrease the tick length.
The Divisions are the number of divisions (gaps) between
the major tick marks. The value should be between 1 and 20. A value of
one creates no minor tick marks and one gap. A value of 10 is entered
into the Divisions box, there are nine minor tick marks and 10
gaps between major ticks. To change the number of divisions, highlight
the existing value and type the desired value. Press ENTER on the keyboard
to make the change. Alternatively, click the ![]() to increase
or decrease the number of divisions.
to increase
or decrease the number of divisions.
To control the number of tick mark divisions for a scale bar linked to a log item, click on the log to select it. In the Property Manager, click on the Line tab. Change the Scaling to User Defined. In the Show Minor Variables Grid Lines section, set the Grid Division to the desired number of divisions. The scale bar updates.
See Also