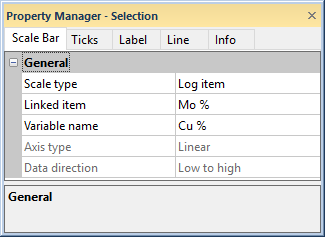
The Scale Bar tab in the Property Manager includes scale bar options such as the type of scale bar, scale bar range, axis type, data direction, and tick mark properties.
Set the scale bar properties on the
Scale Bar tab in the Property Manager.
The scale bar Scale type determines how the scale bar is created. Available options are User defined, Log item, or Cross section. The Log item type creates a scale bar for line/symbol, crossplot, bar, tadpole, or function logs where the scale is linked to the log. The User defined type creates a scale bar that is not linked to a particular log item. This is useful for displaying general information. The Cross section type creates a scale bar that is linked to a cross section. To change the type, click on the existing option and select the desired option from the list.
When the Scale type is set to Log item or Cross section, the Linked item option becomes available. The Linked item is the log that contains the variable that should be used to set the scale on the scale bar, or the Linked item is the cross section that should be used to set the scale on the scale bar. To change the log item, click on the existing log name and select the desired log name from the Linked item list. The list contains all line/symbol, crossplot, bar, tadpole, and function logs that exist in the current borehole view. Once a log item is selected, the scale bar is moved horizontally so that it is aligned with the log item. In addition, the scale bar resizes to the same width as the log item. Scale bars attached to log items can be moved vertically, but not horizontally. By default the scale bar line color and opacity is updated to match the linked log line color. To set the scale bar line color independently of the log line color, uncheck the Use log line color check box on the Line page.
Line/Symbol logs can have more than one variable displayed on the plot. When the Scale type is set to Log item, the Variable name property is enabled. The Variable name property specifies which variable is used to set the scale of the scale bar. The Variable name list is populated by the variables displayed on the line/symbol log. Click the current selection and select the desired variable from the list to change the Variable name.
The Axis type is available when the Scale type is set to User defined. The Axis type is the method used to space values on the scale bar. Available options are Linear and Logarithmic. To change the axis type, click on the existing option and select the desired option from the list. When the axis type is linear, values are evenly spaced along the scale bar. When the axis type is logarithmic, a Log (base 10) scale is used to space the values. The distance between 1 and 100 covers the same amount of the axis as the distance between 100 and 1000 or 1000 and 10,000. When set to Logarithmic, data values equal to and less than zero are ignored.
To control the scaling type for a scale bar linked to a log item, click on the log to select it. In the Property Manager, click on the log's property tab. This is the line/symbol Log, crossplot Log, or bar Log tab. Change the Axis type option. The scale bar updates and the log displays the values with the selected scaling type.
The Data Direction is available when the Scale type is set to User defined or Cross section. The Data direction determines which side of the scale displays the lower and higher values. Available options are Low to High and High to Low. To change the Data direction, click on the existing option and select the desired option from the list. Low to High creates a scale bar with the minimum value on the left and the maximum value on the right. High to Low creates the scale bar with the minimum value on the right and the maximum value on the left.
To control the data direction for a scale bar linked to a log item, click on the log to select it. In the Property Manager, click on the log's property tab. This is the line/symbol Log, crossplot Log, or bar Log Property Manager page. Change the Data direction option. The scale bar updates and the data reverses direction, if needed. The Data direction is not available for a tadpole plot.
See Also