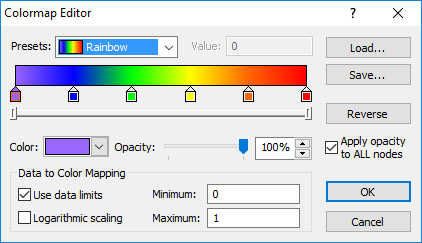
The Colormap Editor is used to assign either preset or custom color spectrums to a gradient fill.
A colormap has specific colors assigned to nodes along the displayed color spectrum. Strater automatically blends colors between the nodes to produce a smooth color gradation over the fill. After you create a colormap, you can save the spectrum as a .CLR file for later use with other fills. Several predefined colormaps are available in the fill properties menu and in the Presets field in this dialog.
The Presets drop-down menu allows you to select a predefined gradient fill. Custom colormaps cannot be added to the preset drop-down list. Presets can be the basis for custom .CLR files, but cannot be changed and saved with the original Preset name. When you make any change to an existing colormap its name automatically changes in the Preset field to Custom.
A colormap spectrum consists of start and end Anchor Nodes that are associated with specific colors. The colormap automatically linearly interprets the two colors in a seamless transition from the first color to the last color. In addition, you can add multiple anchor nodes to any position in the spectrum and assign different colors to each node. In all cases the nodes indicate the point where color transitions begin between the nodes on each side of the new node.
The Value displays the numerical location of the selected node on line, which always begins with the left-most node at 0.00 and the right-most node at 1.00.The numbers for these end nodes cannot be changed. Accurately reposition the selected node by entering a new number in the Value box.
An Anchor Node is a point on
the colormap spectrum that indicates a location where there is a specified
color. In the above example the cursor was placed on the green node  and highlighted. The Color
field indicates the current color associated with the selected node. The
Value field lists the location
of the node on the colormap line, in which the 0 point is the left-most
node and 1.00 is the right-most node.
and highlighted. The Color
field indicates the current color associated with the selected node. The
Value field lists the location
of the node on the colormap line, in which the 0 point is the left-most
node and 1.00 is the right-most node.
To add an anchor node, left-click below or on the colormap where you want the new node added. The new anchor is automatically assigned a color in the color palette, and the value is displayed in the Value field. In the above example, the green node is at the .4000000596 point of the line between the start 0.0 point and the end 1.0 point (or a bit over 40%). You can add as many anchor nodes as you want. This lets you blend colors in many different ways on the colormap.
Highlight an existing node to edit its color or location. When highlighted you can change its associated color by clicking inside the Color box and using the Color Palette to select a new color. To change its location on the colormap spectrum either drag it to its new location or click inside the Value field and enter the specific numerical location in the colormap spectrum.
When any change is made to an anchor node's location or color the name of the colormap changes to Custom.
To delete an existing node, select the node and press the DELETE key on the keyboard. Nodes can also be dragged outside the top or bottom of the dialog to remove it from the spectrum. The first (far left) and last (far right) anchor nodes cannot be deleted.
Click Load to open the Open dialog where you can select an existing colormap file .CLR. Double-click the file you want to use with the current fill property, and the colormap is updated to show the colormap file settings.
Click Save in the Colormap dialog to open the Save As dialog where you can create a colormap file .CLR based on the current colormap settings. Type the file name for the colormap file and click Save. The file is saved for use with other data files.
The Reverse button flips the order of colors in the colormap so that colors currently associated with low data values will be mapped to high values and colors currently associated with high values will be mapped to low values. The sample colormap updates to show the new color order.
The scroll control is a horizontal bar with draggable end handles. Use the scroll control to zoom into an area of the colormap spectrum for more precise editing:

Drag a handle left or right to zoom the colormap in or out. Drag the center section to scroll the visible portion left or right. Double-click the center section to return it to the fully visible state.
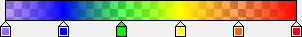
Change the Opacity of a node by selecting the node and entering a value from 0% (completely transparent) to 100% (completely opaque), using the arrow buttons to the right of the box, or dragging the slider to change the opacity percentage. Uncheck the Apply opacity to ALL nodes check box if you wish to change the opacity for only one node.
When Opacity is assigned to the spectrum its appearance changes. In the following example the purple, green, and orange nodes were assigned opacity of 62% and the blue, yellow, and red nodes were 100% opaque:
You can adjust the opacity of a colormap
spectrum to all nodes or to individual nodes.
Click Apply Opacity to ALL nodes to change the opacity for all nodes. Un-check Apply opacity to ALL nodes to change individual node opacity.
The Data to Color Mapping group contains options for setting the minimum and maximum data values to use in the colormap.
Check the Use data limits check box to use the data minimum and maximum values.
If you would prefer to set the colormap minimum and maximum values to other values, enter the new numbers into the Minimum and Maximum boxes. This is useful when you are plotting different data sets in a similar range and would like to have the same data values represented by the same colors each time. If a data value within the log falls outside this range, it is assigned the minimum or maximum color, whichever is closest.
Check the box next to the Logarithmic scaling to set the intervals between the nodes to a log(10) scale. The Minimum and Maximum values remain the same. The nodes between the minimum and maximum and the color definitions adjust to fit the log(10) scale. On a log(10) scale, there is as much distance on the colormap sample between 1 and 10 as between 10 and 100 or 100 and 1000. To use a regular linear scale on the colormap, uncheck the box next to Logarithmic scaling.
When you have made all the edits you want click OK. To exit the Colormap Editor without saving any changes click Cancel.
See Also